
Most of the time the stock market is below its previous high.
That may seem surprising, given the market's long-term record of growth. Yet declines from previous highs are a normal part of investing, ranging from brief setbacks to prolonged periods of substantial losses.
Understanding how often these drawdowns occur, and when they matter most, can help investors maintain perspective and make better long-term decisions.
The High Water Mark
A high water mark is the highest value an investment has reached. Any time its current value is lower, the investment is in a drawdown. The percentage decline from that previous high measures the depth of the drawdown. When a new high is reached, the drawdown returns to zero and the high water mark moves up.
This is often how investors experience their portfolios. Rather than comparing today's value with where they started years ago, they compare it with the highest value they've seen. Even an investment that has appreciated substantially can feel disappointing when its current value falls below that reference point.
How often does this happen, and how far below their previous highs do markets typically fall?
155 Years of Being Below the Peak
Applied mathematician and hedge fund manager Robert Frey explored this question in his presentation An Analysis of 180 Years of Market Drawdowns. The analysis below applies a similar approach to a U.S. stock market total-return series extending from 1871 through 2025.
The chart tracks the S&P 500 Index and its historical predecessor, with dividends reinvested. The line sits at zero when the index reaches a new high and falls below zero whenever the index is below its previous peak.
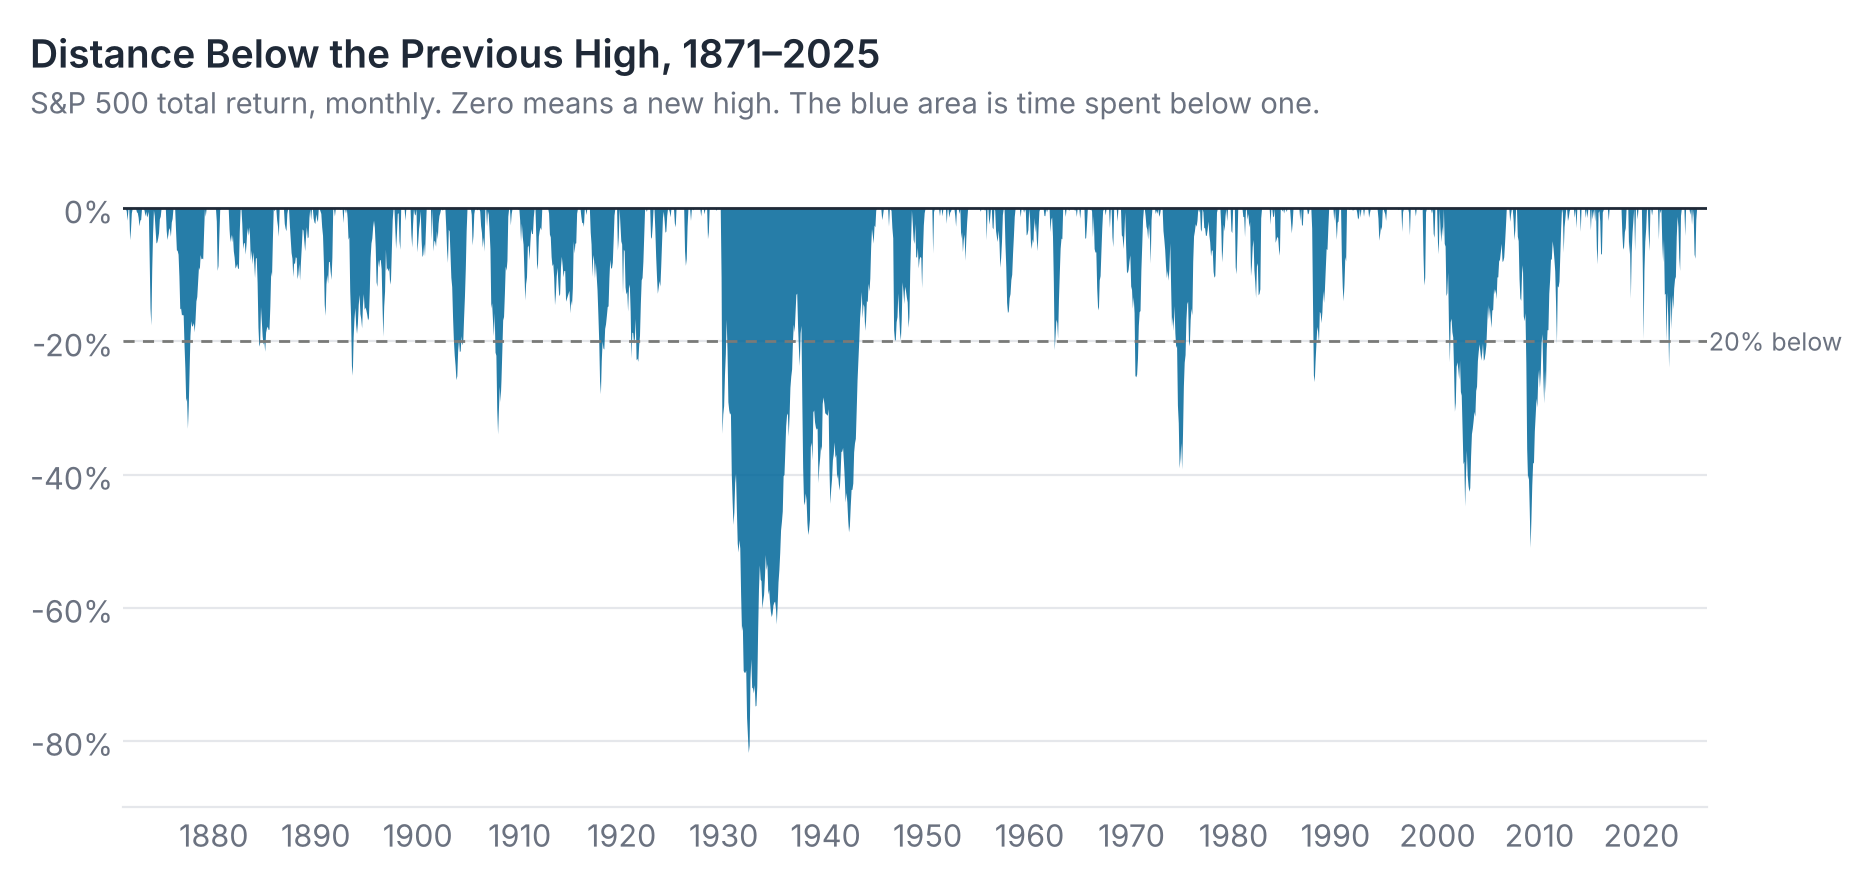
Across the full 155-year period, the market ended 69% of months below its previous high. It reached or exceeded that high in the remaining 31%.
An investor monitoring the index at the end of each month would therefore have seen a value below its previous peak roughly seven months out of ten, even as the index grew substantially over the full period.
Most drawdowns were relatively modest, but deeper declines could persist for years. There were 15 distinct drawdowns of 20% or more over the period.
Following the 1929 peak, the index did not regain its previous high, including reinvested dividends, until January 1945, more than 15 years later. The drawdown beginning in 2000 took 74 months to recover, while the one beginning in 2007 took 53 months.
These episodes illustrate why the depth and duration of drawdowns matter as much as their frequency.
The Modern Record Looks Similar
One might reasonably assume that the long-term results are heavily influenced by the Great Depression, but the pattern persists in more recent history as well. From October 1999 through December 2025, the S&P 500 Total Return Index ended 69% of months below its previous high, the same proportion as the full historical period.
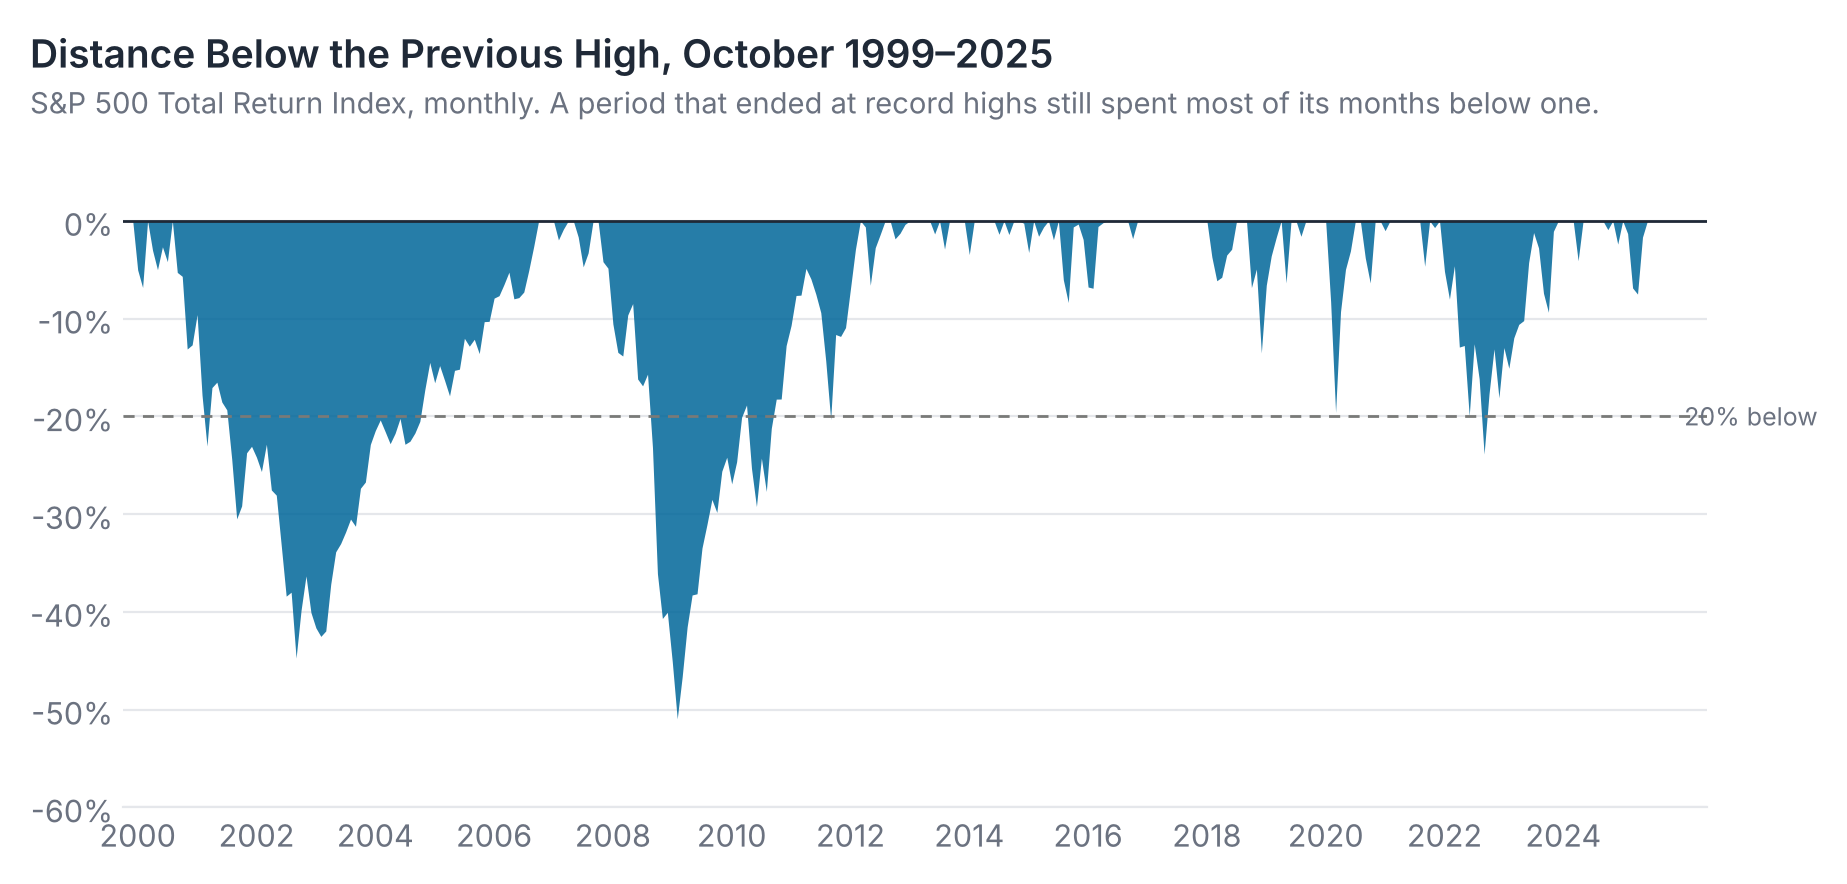
The modern period had a greater share of deep drawdowns, with the index sitting 20% or more below its previous high in 21% of months, compared with 15% over the full historical period. Much of this difference reflected the prolonged declines and recoveries following the market peaks in 2000 and 2007.
Share of Months at or Below Previous Highs
| Market position | 1871–2025 | Oct. 1999–2025 |
|---|---|---|
| At a new high | 31% | 31% |
| Below high by less than 10% | 38% | 32% |
| 10% to less than 20% below | 16% | 16% |
| 20% or more below | 15% | 21% |
The Experience of Being Invested
Stocks have generated substantial compounded returns over long periods, and many drawdowns have been relatively shallow and brief. In the full historical record, the median completed drawdown lasted just three months.
But the experience of being invested can feel quite different from the long-term results.
Investors naturally anchor to the highest value their portfolios have reached. A portfolio that has grown substantially but sits 12% below its peak can feel like a loss, even if its value remains well above the original investment.
That discomfort can lead investors to sell after declines, wait for a better entry point, or abandon an otherwise reasonable investment plan.
For investors drawing income from their portfolios, drawdowns present an additional challenge beyond psychology. Withdrawals during a market decline reduce the capital available to participate in a subsequent recovery.
This is one aspect of sequence risk, which we discuss in greater detail in How Sequence Risk Can Impact Your Retirement. The depth of a drawdown can be especially consequential when an investor is withdrawing money rather than adding to a portfolio.
The Arithmetic of Getting Back
A percentage loss and the percentage gain required to recover from it are not the same.
| Decline from previous high | Gain required to recover |
|---|---|
| 10% | 11% |
| 20% | 25% |
| 30% | 43% |
| 40% | 67% |
| 50% | 100% |
A 10% decline requires an approximately 11% gain to recover. But a 50% decline requires a 100% gain, meaning the portfolio must double simply to return to its previous value.
This asymmetry becomes increasingly significant as losses deepen. For example, a 40% decline requires a subsequent gain of approximately 67% to recover, compared with 43% following a 30% decline.
Even a modest reduction in the depth of a substantial drawdown can therefore make a meaningful difference in the return required for recovery, particularly when withdrawals are occurring.
What This Means for Investors
Being below a previous high water mark is a normal part of investing, not necessarily a sign that something has gone wrong. Keeping this in perspective can help investors evaluate their progress against long-term financial objectives rather than the highest value their portfolio has ever reached.
But the consequences of drawdowns vary with an investor's circumstances.
For someone with decades before retirement, a substantial decline may primarily test patience and discipline. For someone approaching retirement or drawing income from a portfolio, the financial consequences can be more significant.
This is one reason we believe portfolio management should consider not only long-term returns, but also valuations, market conditions, and each investor's financial circumstances.
At times, that may mean accepting less participation in a rising market when valuations appear unattractive, with the objective of maintaining a more favorable balance between long-term opportunity and risk.
Such decisions cannot eliminate drawdowns or guarantee smaller losses. But considering valuations, particularly when the consequences of a substantial decline are greatest, is an important part of our approach to managing portfolios.
The goal is not to avoid every decline. It's to maintain an investment strategy that can withstand them, both financially and emotionally.
Note: Data and Methodology
Historical data. The analysis uses monthly total returns for U.S. large-company stocks, with dividends reinvested, from January 1871 through December 2025.
For January 1871 through September 1999, the source is Robert Shiller's monthly S&P Composite data, including monthly average prices and dividends, as used in Irrational Exuberance and updated on his Yale University website.
For October 1999 through December 2025, the source is the S&P 500 Total Return Index from S&P Dow Jones Indices. The two series are chained at October 1999. The modern-period analysis uses the S&P 500 Total Return Index alone.
Analytical framework. The framing follows Robert Frey's An Analysis of 180 Years of Market Drawdowns. The calculations presented here are AZA Capital Management's own, using the data described above. Results differ from Frey's analysis because of differences in time periods, data sources, and return definitions.
Drawdown calculations. A high water mark is the highest observed monthly value of the total-return series to date. A drawdown is the percentage by which a month's value falls below that mark. Months at or above the previous high have a drawdown of zero.
Because the data are monthly, and the pre-1999 prices are monthly averages, declines occurring within a month may not be fully captured. The historical and modern series also use somewhat different price observation conventions, which can affect comparisons.
Recovery calculations. The gains required to recover from various losses are calculated as Required Gain = 1 ÷ (1 − Decline) − 1. These calculations are mathematical relationships and do not depend on historical market performance.
Important considerations. Historical returns are nominal and before fees, expenses, and taxes. Indexes are unmanaged and cannot be invested in directly. The results do not represent the performance of any AZA Capital Management strategy or investment product. An all-stock index also does not represent a diversified investment portfolio.
Historical drawdown patterns do not predict future market behavior or establish that any particular investment approach will reduce losses or shorten recovery periods. Investing involves risk, including possible loss of principal. Past performance does not guarantee future results.
This article reflects the views of its author as of the publication date shown above. Those views may change without notice, and we don't undertake to update the article. It is provided for informational and educational purposes only and is not a recommendation, an offer, or a solicitation to buy or sell any security or to adopt any investment strategy. Nothing here is personalized investment, tax, or legal advice; consider your own situation and talk with a qualified professional before making a decision.
Some information comes from third-party sources we believe to be reliable, but we haven't independently verified it and can't guarantee its accuracy or completeness. This article may contain forward-looking statements, predictions, forecasts, projections, and market expectations concerning our beliefs and opinions in respect of the future. Forward-looking statements necessarily involve risks and uncertainties, and undue reliance should not be placed on them. There can be no assurance that forward-looking statements will prove to be accurate, and actual results and future events could differ materially from those anticipated in such statements. Charts and examples are for illustration only. Investing involves risk, including the possible loss of principal. Past performance does not guarantee future results, and no strategy, including those recommended by AZA Capital Management, can assure a profit or protect against loss.
AZA Capital Management, its employees, and client accounts may hold positions in securities mentioned and may change those positions at any time without notice. Not every client portfolio will hold a security or follow a strategy discussed, since each is managed according to the client's own objectives and circumstances. We're not responsible for the content of third-party websites linked from this article.