
Note: Updated April 2026 with returns through 2025. Originally published September 2019.
Investors often focus on average returns when comparing options, and in many ways, it makes sense. Averages provide a useful starting point when other factors, such as time period and risk, are similar.
But as a summary of an entire period, an annualized return tells only part of the story. It says nothing about the gains and losses along the way, or how their timing affects someone adding to or withdrawing from a portfolio.
To illustrate the difference between an average and its components, consider the S&P 500 Index from 1999 through 2025. During that time, it produced an annualized return of approximately 8.5%, including reinvested dividends. Calendar-year returns were above the average in 17 years and below it in 10, ranging from a 37% loss in 2008 to a 32% gain in 2013. Moreover, no calendar-year return landed within one percentage point of the average.
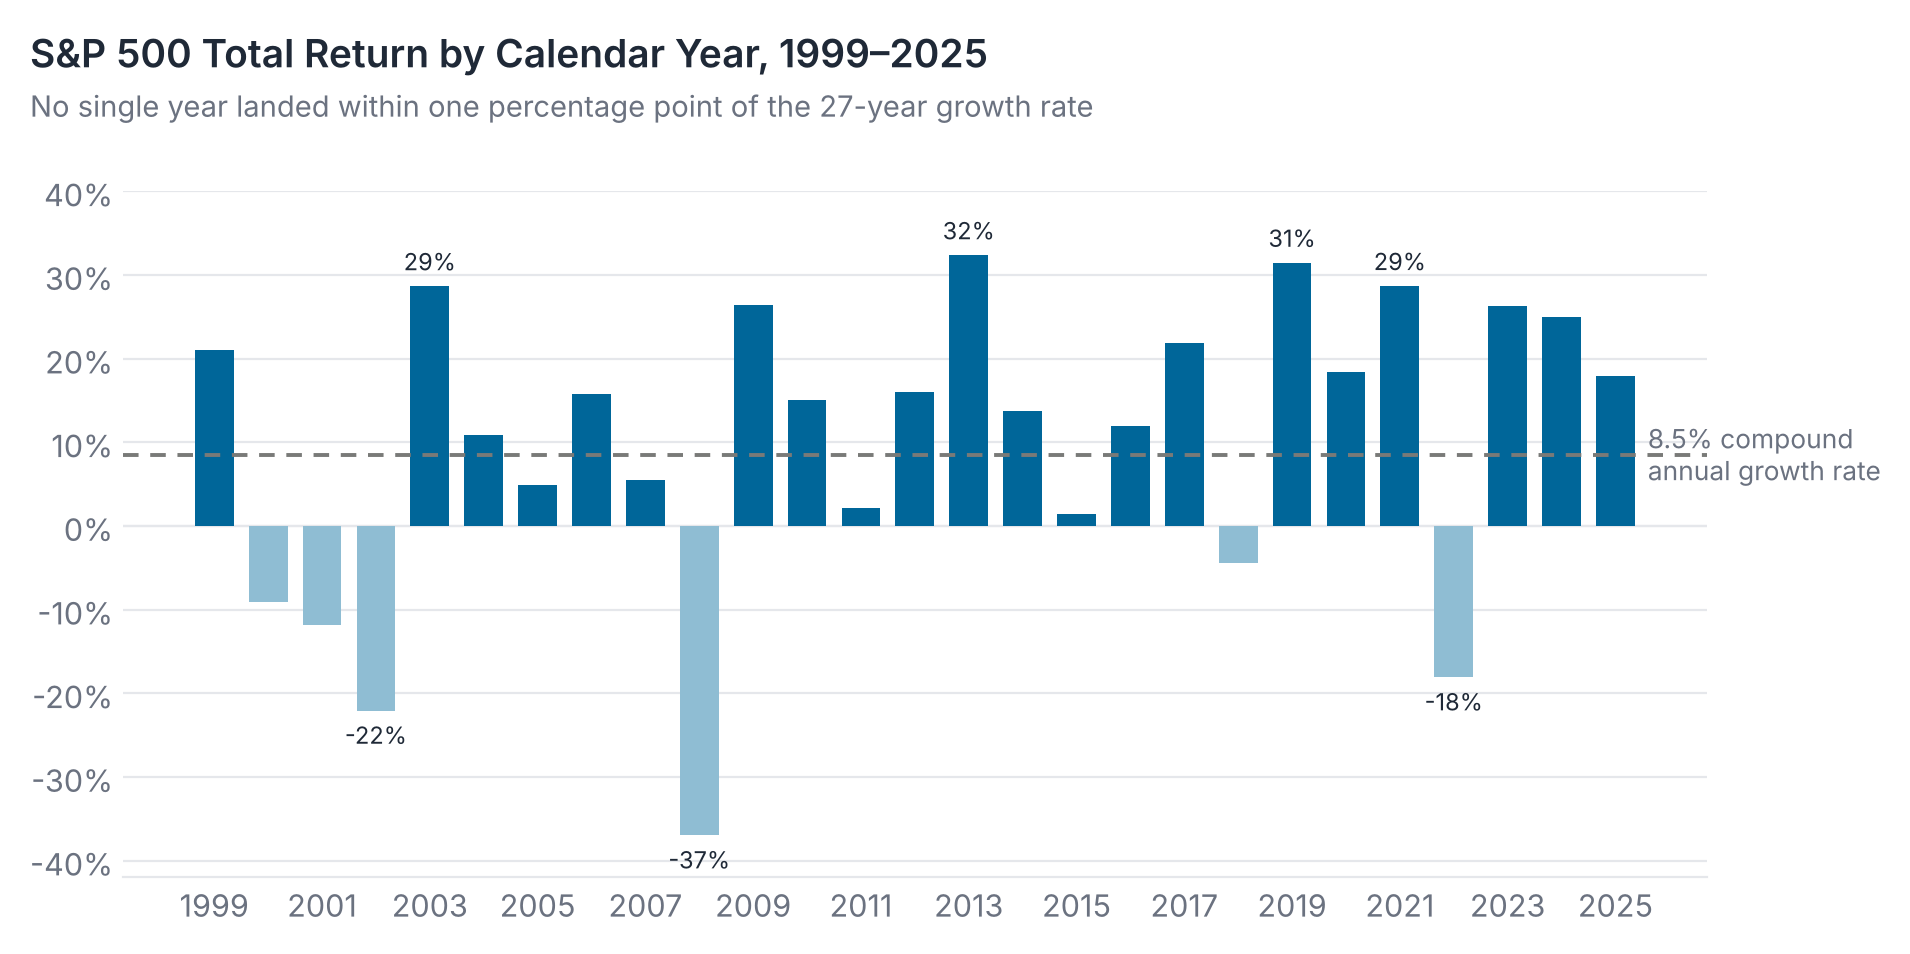
Even among investments with the same average return, the order in which the underlying periodic returns occur can have a material impact. This effect is called sequence risk, or sequence of returns risk. It can materialize when money is added to or withdrawn from a portfolio, so it can affect a wide range of investors, such as employees contributing to a 401(k), retirees drawing income from an IRA, or endowments supporting an organization's spending.
The examples below use the S&P 500's actual calendar-year returns and then the same 27 returns in reverse order to illustrate the effect. Both return sequences have the same annualized return, and without contributions or withdrawals, they produce the same ending balance. Once cash flows are added, however, the order of returns changes the outcome materially.
No Cash Flows: Different Paths, Same Ending Balance
Example A. Suppose a $100,000 portfolio earned the S&P 500's total returns from the end of 1998 through the end of 2025, with no contributions or withdrawals.
After 27 years, the portfolio would have grown to approximately $911,398, an annualized return of approximately 8.5%.
If the same returns had occurred in reverse order, the portfolio would have followed a different path but reached the same ending balance.
A constant annual return equal to the period's annualized return of 8.5% would also have produced that same ending balance.
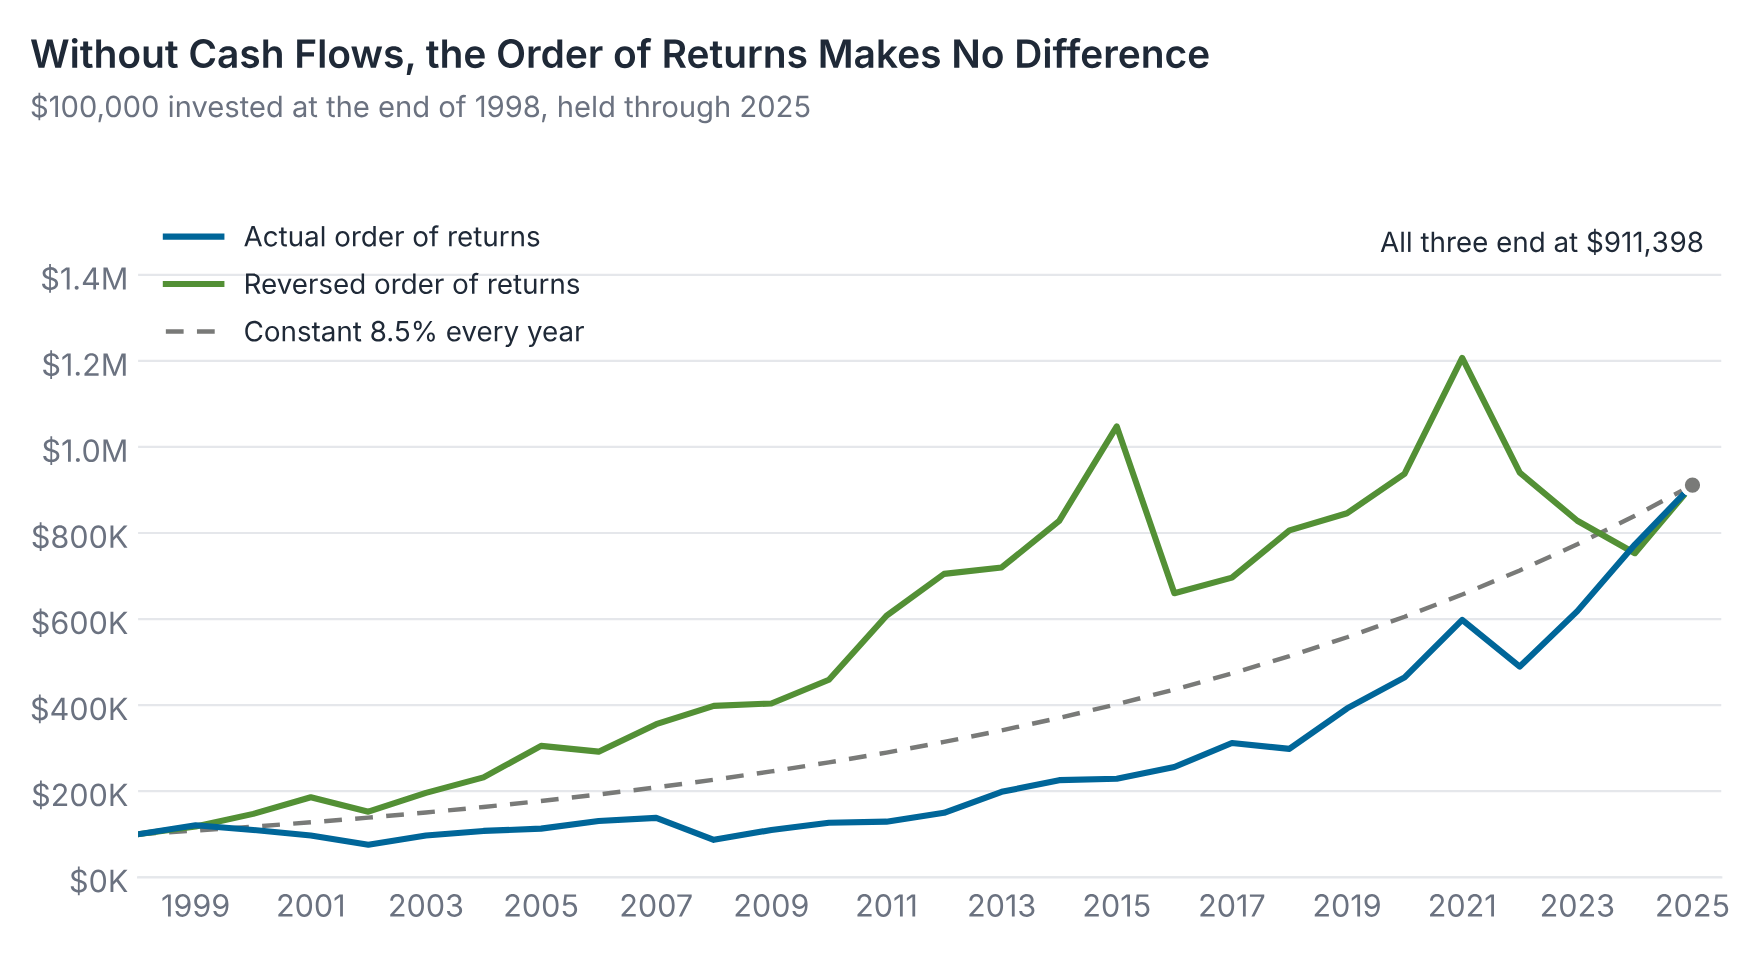
Without cash flows, rearranging the order of returns does not change the ending balance over this fixed period. In reality, the interim experience still matters, since different losses and recoveries could affect an investor's decisions. But mathematically, the ending value is the same.
That changes when money regularly enters or leaves the portfolio.
Building Savings: Why Later Returns Matter
Example B. Start with the same $100,000 initial balance but now deposit $24,500 at the end of each year for 27 years.
Using the actual sequence of returns, the portfolio would have grown to approximately $4,569,180 at the end of 2025. However, with the same returns in reverse order, it would have ended at approximately $2,515,975.
The starting balance, annual contributions, and annualized return are identical. The difference comes from the order of returns.
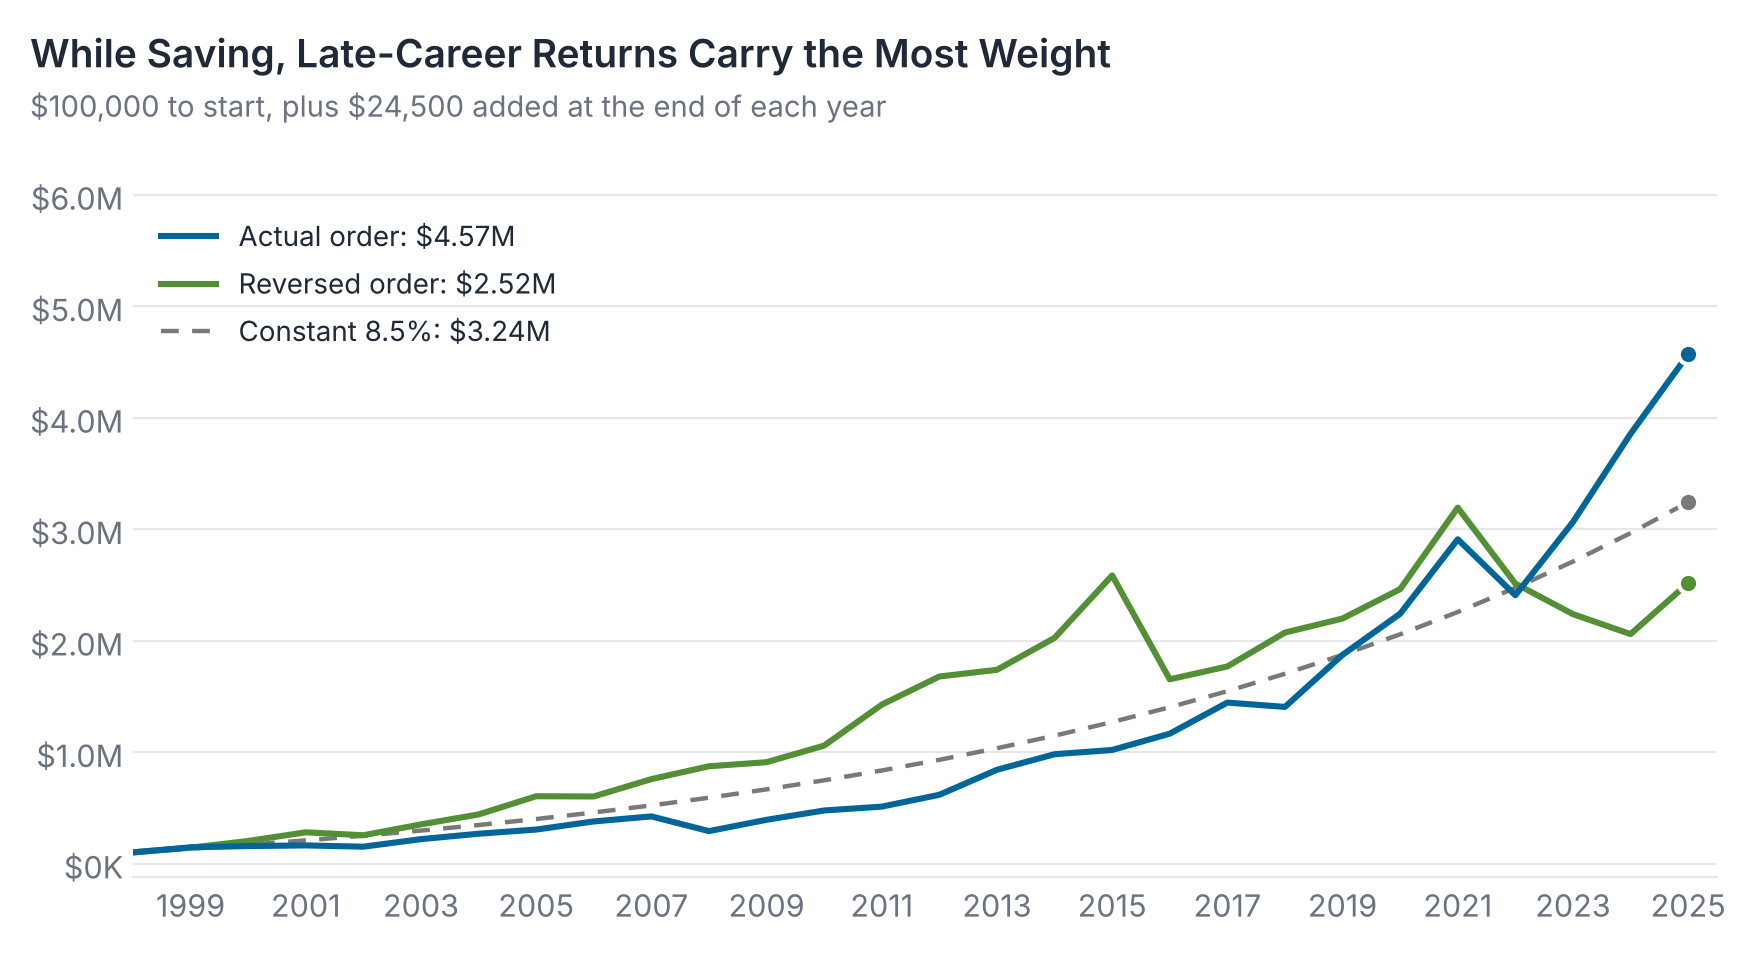
Returns later in the accumulation period can have a greater dollar impact because they apply to a larger balance. A 10% loss on $1 million is $100,000, far more than a single annual contribution in this example.
Reversing the returns moves the losses of 2000 through 2002 into 2022 through 2024, when the portfolio has accumulated many years of contributions and growth. Those late losses result in a substantially lower ending balance.
Drawing Income: Why Early Losses Matter
Sequence risk can be particularly consequential when a portfolio is funding withdrawals.
Example C. Consider a $1 million portfolio at the end of 1998. It provides a $55,000 withdrawal at the end of the first year, with that amount increasing by 2% each year to reflect assumed inflation.
Using the actual sequence of S&P 500 returns, the portfolio could no longer fund the full scheduled withdrawal in 2020. It entered that year with a balance of about $10,800, against a scheduled withdrawal of $83,362. With the same returns in reverse order, it would have ended 2025 with approximately $4,861,854.
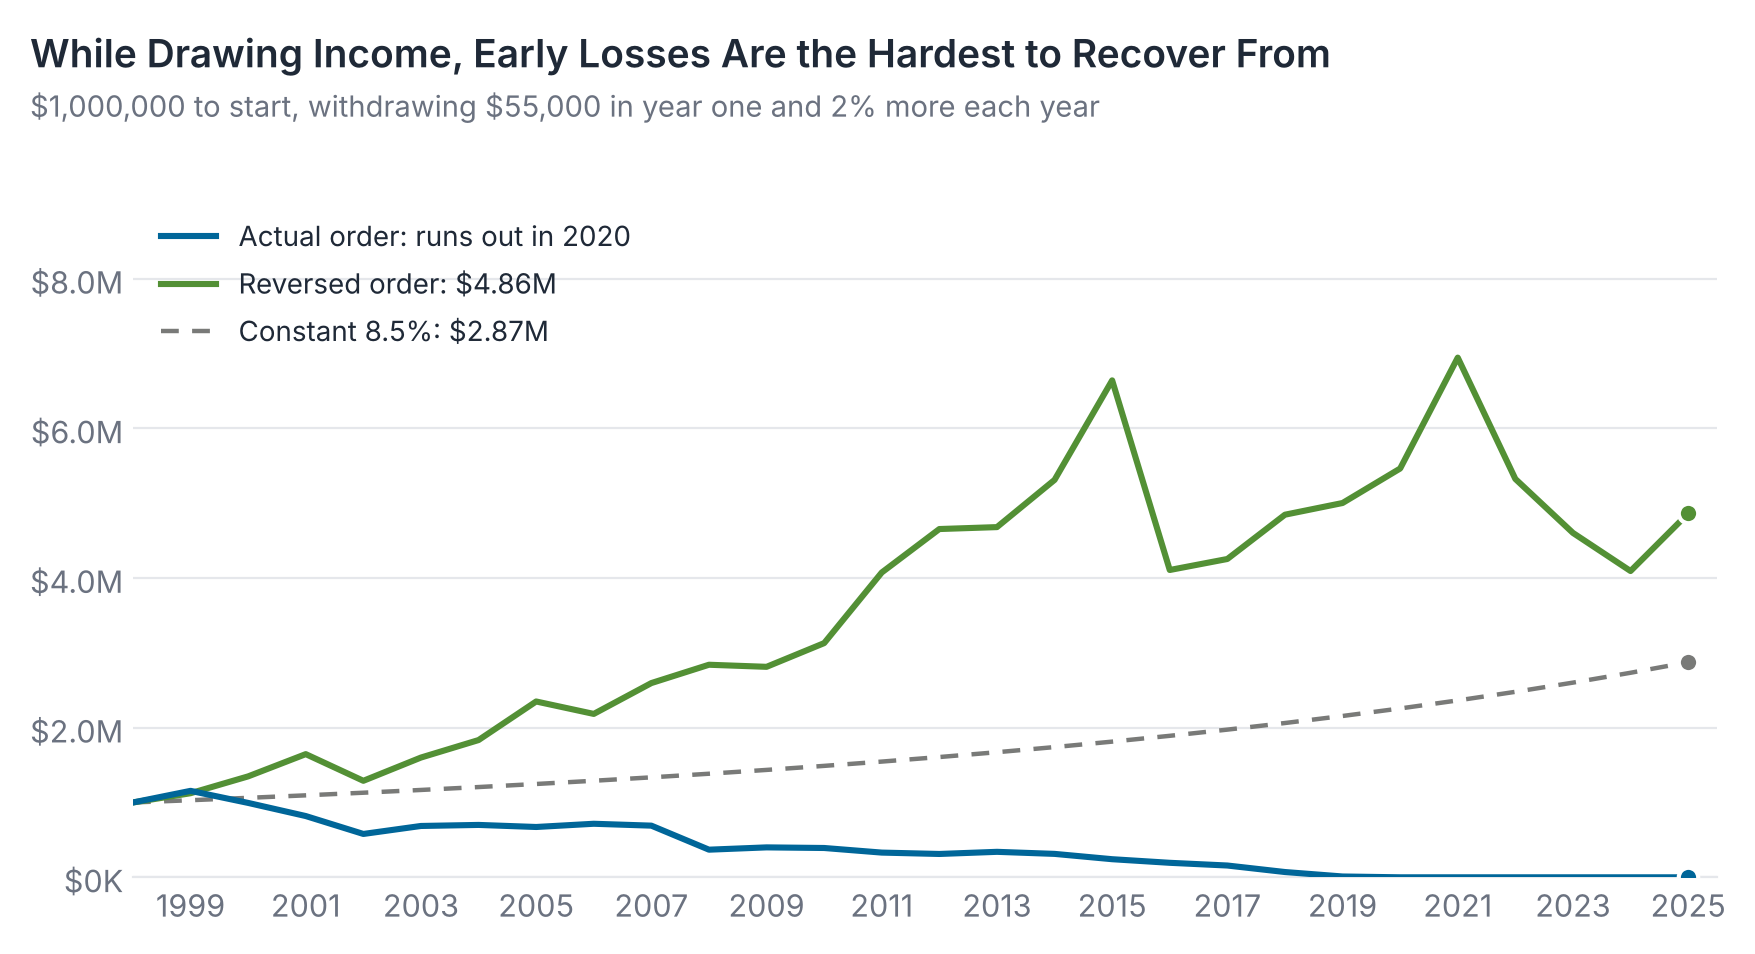
A loss reduces the portfolio's value, and a withdrawal reduces it further. When both occur early in retirement, fewer assets remain to participate in a recovery. Continuing withdrawals can make it harder for the portfolio to regain ground, even when subsequent returns improve.
By contrast, favorable early returns can build a larger balance before later losses occur. That helps explain why the two sequences produce such different outcomes despite having the same annualized return.
Results at a Glance
| Example | Actual | Reversed | Constant 8.5% |
|---|---|---|---|
| No cash flows | $911,398 | $911,398 | $911,398 |
| Adding $24,500 a year | $4,569,180 | $2,515,975 | $3,242,252 |
| Drawing $55,000 a year | Depleted in 2020 | $4,861,854 | $2,874,023 |
These examples illustrate the effect of return sequence. They are not forecasts of future returns or sustainable withdrawal rates. See "About These Examples" below.
Looking Beyond the Average
Return sequences with the same annualized return can produce very different results when money is regularly added to or withdrawn from a portfolio. That applies to an employee contributing to a 401(k), a retiree drawing income from an IRA, and an endowment supporting an organization's spending. For each of them, the path of returns matters alongside the long-term growth rate.
Sequence risk is often greatest when a large balance is exposed to losses while money is moving in or out. For savers, that is often the final years before retirement. For retirees, it is often the early years of withdrawals. For an endowment, or any portfolio with ongoing distributions, it is any period when spending continues through a market decline.
A constant-return projection alone does not show how different sequences could affect a plan. Scenario analysis and methods such as Monte Carlo simulation can explore a wider range of outcomes, although their results depend on the assumptions used and are not guarantees.
Planning should consider those outcomes alongside contributions or spending needs, available reserves, and investment exposures.
As illustrated, it's important to look beyond the averages by also considering the path of returns when analyzing an investment.
S&P 500 Total Return by Calendar Year
| Year | Return | Year | Return | Year | Return |
|---|---|---|---|---|---|
| 1999 | 21.04% | 2008 | −37.00% | 2017 | 21.83% |
| 2000 | −9.11% | 2009 | 26.46% | 2018 | −4.38% |
| 2001 | −11.88% | 2010 | 15.06% | 2019 | 31.49% |
| 2002 | −22.10% | 2011 | 2.11% | 2020 | 18.40% |
| 2003 | 28.69% | 2012 | 16.00% | 2021 | 28.71% |
| 2004 | 10.88% | 2013 | 32.39% | 2022 | −18.11% |
| 2005 | 4.91% | 2014 | 13.69% | 2023 | 26.29% |
| 2006 | 15.80% | 2015 | 1.38% | 2024 | 25.02% |
| 2007 | 5.49% | 2016 | 11.96% | 2025 | 17.88% |
Source: S&P Dow Jones Indices, S&P 500 Total Return Index. Calculations use the calendar-year returns displayed in this table. The annualized return (compound annual growth rate) for 1999–2025 is approximately 8.53%.
Note: About These Examples
These illustrations use the S&P 500 Total Return Index's calendar-year returns for 1999–2025 in their actual order, in reverse order, and as a constant return equal to the period's annualized return (compound annual growth rate). The reversed-order and constant-return paths did not occur and are included only to illustrate the effect of return sequence.
Total returns include reinvested dividends. Indexes are unmanaged, and it is not possible to invest directly in an index. The examples do not reflect advisory fees, investment expenses, taxes, or the results of any investment product or AZA strategy. Such costs would reduce the balances shown. An all-stock index does not represent a diversified retirement portfolio.
Each year's investment return is applied before the year-end contribution or withdrawal. Annual contributions are held constant at $24,500 for illustration and do not represent historical contribution limits. Withdrawals begin at $55,000 and increase by an assumed 2% annually. Actual inflation and spending needs will vary.
If the portfolio cannot fund a scheduled withdrawal, its remaining balance is withdrawn and the balance is shown as zero thereafter. No further withdrawals are funded from that portfolio.
The constant-return calculations use the unrounded annualized return derived from the displayed annual returns. Dollar figures are rounded to the nearest dollar.
These examples are based on historical index returns and do not predict future results. They do not establish that any investment approach will prevent losses or sustain a particular withdrawal rate. Investing involves risk, including loss of principal. Past performance does not guarantee future results.
This article reflects the views of its author as of the publication date shown above. Those views may change without notice, and we don't undertake to update the article. It is provided for informational and educational purposes only and is not a recommendation, an offer, or a solicitation to buy or sell any security or to adopt any investment strategy. Nothing here is personalized investment, tax, or legal advice; consider your own situation and talk with a qualified professional before making a decision.
Some information comes from third-party sources we believe to be reliable, but we haven't independently verified it and can't guarantee its accuracy or completeness. This article may contain forward-looking statements, predictions, forecasts, projections, and market expectations concerning our beliefs and opinions in respect of the future. Forward-looking statements necessarily involve risks and uncertainties, and undue reliance should not be placed on them. There can be no assurance that forward-looking statements will prove to be accurate, and actual results and future events could differ materially from those anticipated in such statements. Charts and examples are for illustration only. Investing involves risk, including the possible loss of principal. Past performance does not guarantee future results, and no strategy, including those recommended by AZA Capital Management, can assure a profit or protect against loss.
AZA Capital Management, its employees, and client accounts may hold positions in securities mentioned and may change those positions at any time without notice. Not every client portfolio will hold a security or follow a strategy discussed, since each is managed according to the client's own objectives and circumstances. We're not responsible for the content of third-party websites linked from this article.